First -- I really don't like to talk about the DOW. Simply put, 30 stocks in a sea of 10,000 just doesn't make sense. I like far broader averages to gauge the market.
Here's a chart of the SPY's:
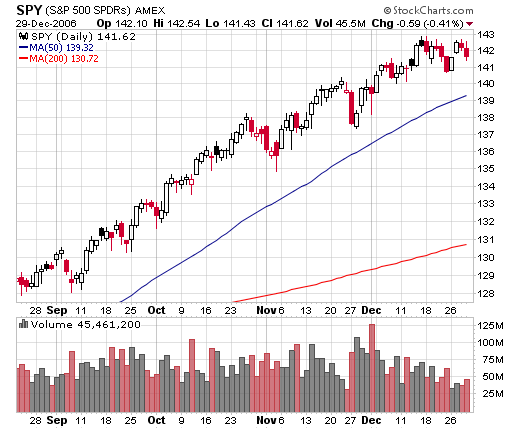
This is the strongest chart of the three I'll look at today. The S&P 500 is still in the middle of a strong uptrend. However, there are two points of concern right now. The first is the decreasing volume totals for December. Starting on December 11, we see a clear decrease in trading volume. This might simply be people leaving the market for an early vacation. Or it might be a decrease in actual buying interest. We don't know the underlying reason for the volume decrease; we just know one occurred. The second cause for concern is the possible formation of a double top for the SPY in December. It's not a particularly strong formation, but it exists nonetheless. It's important to remember we've had a strong uptrend for the better part of 5 months now. Simple baseball logic tells us the market is due.
Here's a chart of the Russell 2000;
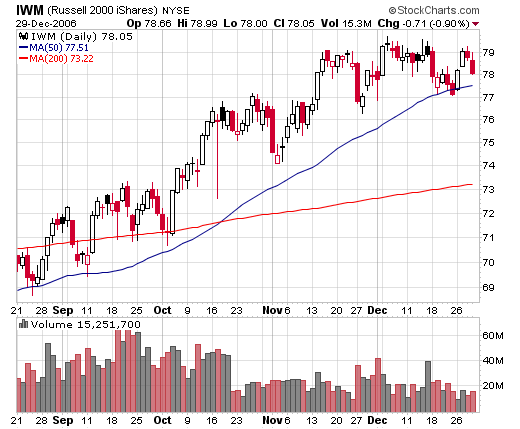
This chart causes a bit more concern. Notice the volume drop-off starting in late October -- about a month and a half before the drop-off in the SPYs. This makes the rally in late November and early December more suspect for the simple reason fewer buyers caused it. Also notice we have a possible head and shoulders topping formation forming. The market may be working on the right shoulder right now.
Here's a chart for the QQQQs:
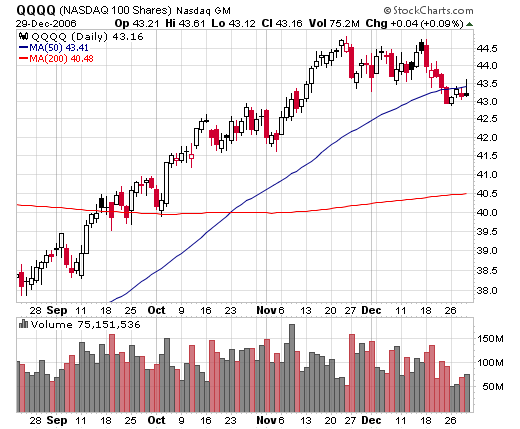
This chart should raise a few eyebrows. First, notice we have another possible double top formation with the first top in late November and the second top in mid-December. Next we have a sell-off from the double top. We have a reaction rally from the sell-off in the last week of December. But, the reaction rally has a very low volume level relative to the preceding sell-off. And we don't have a very strong reaction rally; the sell-ff has some very strong downward bars while the reaction rally has some wimpy, meandering bars. Finally, we have the QQQQ's closing below the 20 day moving average. All of these are bearish signals.
As with all technical analysis, remember this caveat: the markets will always try to humble your analysis. And the markets have a lot of ways to humble you.