Here's the chart for the SPY (S&P 500).
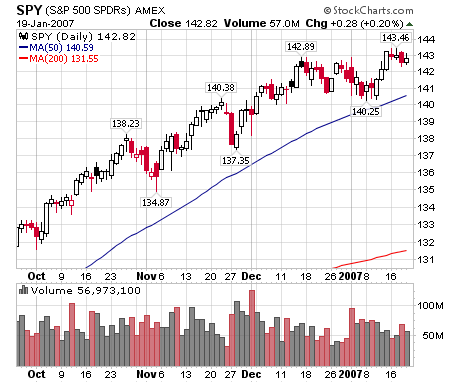
Remember the market's were closed on Monday.
Four days with a slight downward bias that followed three strong upward bars. That indicates several points. First, there was no news strong enough to send the market in either direction. In other words, the good news canceled out the bad news. We had some good earnings news this week (broker dealers), but we also had some bad news (Motorola, IBM, Intel) combined with CPI and PPI implying the Fed won't be lowering rates anytime soon. One analysis described the market thusly:
"I think we're at an extremely pivotal psychological level," said T.J. Marta, economic strategist at RBC Capital Markets. He said earnings and economic data support the Federal Reserve's notion that the economy can pull off a soft landing. Marta contends Wall Street is now mulling whether the economy will do a "fly-by" and skip a soft landing entirely with growth continuing apace.
This analyst didn't mention the implied ceiling caused by the Fed's not acting on interest rates. I think that is a big ceiling on the market right now.
Here's a chart of the QQQQs
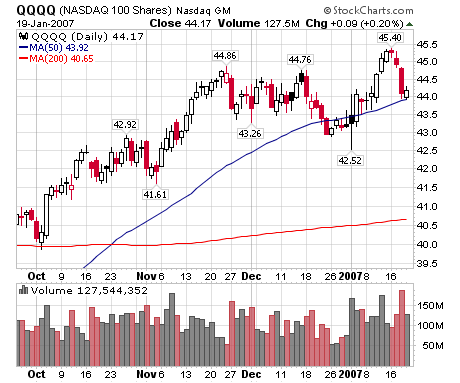
This is where the bad tech news really hit hardest. Technology has reemerged as a market sector over the last 6 months, and the news from Intel, IBM and Apple hit this market hardest. Take a look at various technology related ETFs for the week:
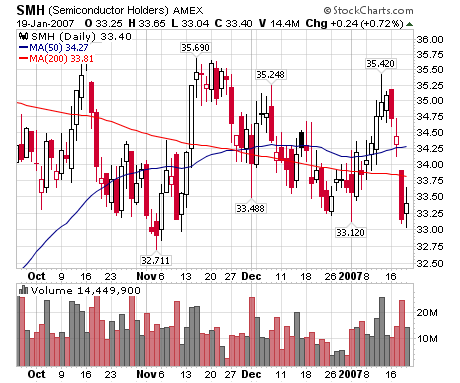
Semiconductors
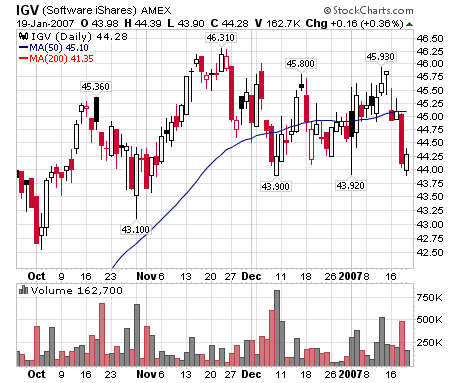
Software
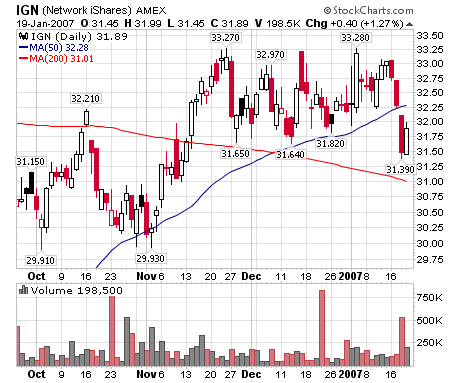
Networking
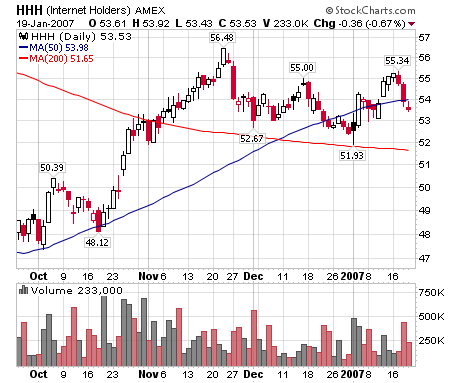
Internet
This charts should cause concern among those in the bullish market camp. Technology has been the driver of the latest rally that started in late July/early August of last year. Now that sector is somewhat suspect going forward.
Here's a chart for the Russell 2000
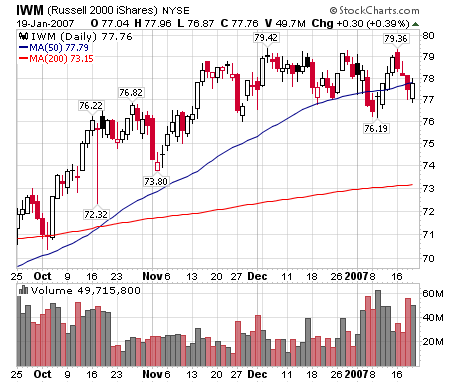
We're back to a trading range for this index, between roughly 76 and 79.50. Trading ranges mean supply and demand are about equal. Traders aren't bullish enough to bid the index higher or bearish enough to sell it lower. We're waiting for some catalyst to make the market decide on one direction.