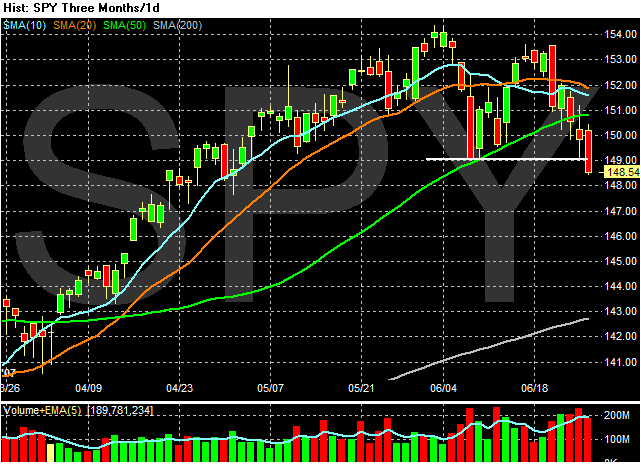
1.) The SPYs closed below support established in early June
2.) The average is below the 50 day SMA
3.) The last three days of selling have occurred on high volume.
In addition, note the post below. Two technical indicators (the MACD and CMF) are negative and the OBV is neutral.
This is what a market that is correcting looks like.
