Here's the 3-year chart. Notice
1.) The index broke out of a channel in late October 2006. Right now the index is bouncing on top of that channel. I you think of the channel as a mean price channel, than recent action is merely a reversion to the mean. Granted -- it could take awhile to return to mean levels.
2.) The 3-year uptrend is still very much intact. The index would have to drop another 7.69% to approach the lower trend line.
Here's a 3-year weekly chart with the MACD. Notice that according to the MACD we could have a bit longer downturn.
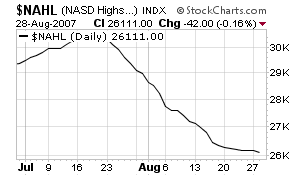
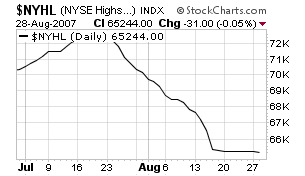
Here are two very important breadth charts from Stockcharts.com. The first is the New York new High/Low and the second is the NASDAQ new high/low. I have been harping on these charts for awhile, but the reason is very sound. When a market is really rallying, stocks are moving to new highs. Over the latest post-Fed rally, the number of new lows and new highs has been equal. That is not a rally.
New York New High/Low
NASDAQ New High/Low