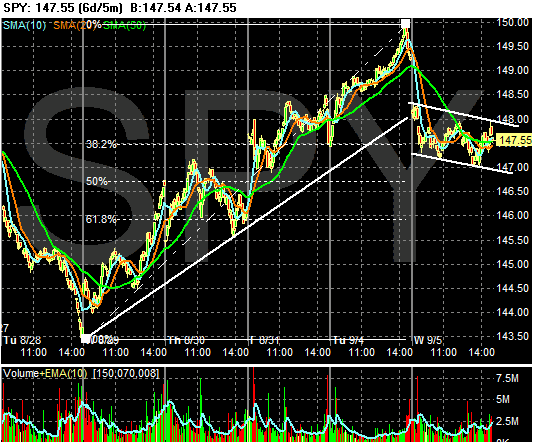
Here's the 5-day chart. This helps to place today's sell-off in a bit more context. First, note the average broke the 5-day uptrend. However, also note the market sold-off to about the 38.2% Fibonacci level. Finally, note the average had support right at the $147 level. My guess is there were some buy programs activated at that level.

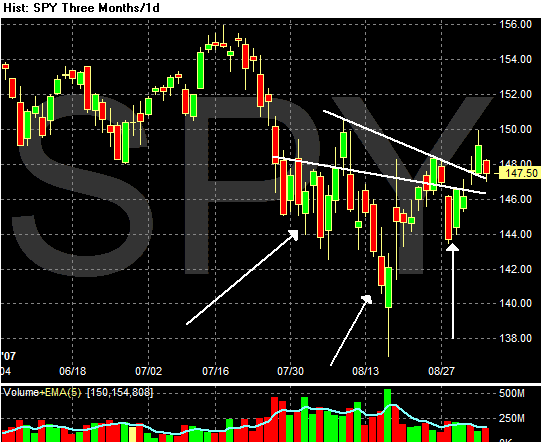
Finally, here's the daily chart, which really puts today's action in a better perspective. Notice we have a pretty clear inverted head and shoulder formation with two possible necklines. Also note today's price action was an inside day. The short version is today's sell-off was hardly fatal to the markets recent upward move. My guess is traders were simply using today's negative news as a reason to sell.

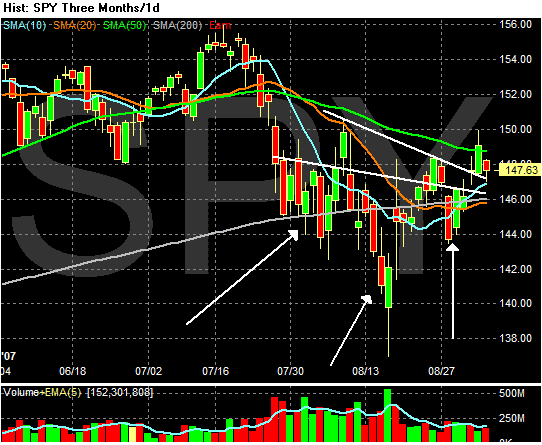
Finally, here's the same chart with the SMAs. Notice we are still above the 200 day SMA.

However, it's important to note the problems with the market listed in the post below. The transports aren't confirming this upward move and the new highs/new lows are not encouraging. While the market can still move up in this environment, the lack of confirming action means there isn't as much support for the move in the broader market. That means the market is probably still susceptible to sudden downward moves.