-- Inflation expectations. Inflation eats into the fixed income stream of bonds. Higher inflation expectations should send the market lower and lower inflation expectations should send the bond market higher.
-- Flight to safety. Government bonds are considered ultra-safe investments, so in times of economic and geo-political stress they should rally.
-- Fed policy. If the Fed is lowering rates previously issued bonds are more valuable because they have a higher coupon. If the Fed is increasing rates the market should sell-off because new bonds have a higher and therefore more attractive coupon.
-- Overall interest rates on the bonds themselves. Remember -- a bonds price and yield move in opposite directions. As prices increase, yields decrease. But yields can only go so far. While they can technically drop to 0%, that is highly unlikely unless we're in serious trouble.
Notice that all of these factors are in play right now. First, commodity inflation is increasing, which should exert downward pressure on the markets. But the credit crunch and yesterday's news from Pakistan should make the flight to safety argument attractive. And then there is Fed policy, which is technically heading lower right now. But the Fed is seriously hemmed in by inflation. In other words -- all three of the primary events that move the bond market are in play right now which makes the day-to-day action really interesting.
Let's look at the charts to see what's going on.
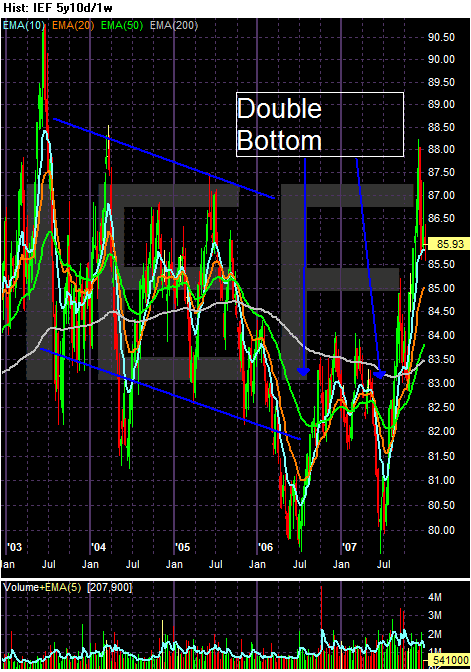
On the 5-year chart of the 7-10 year Treasury curve note the overall chart is one giant trading range between roughly 80 and 88. But there are several smaller trends within that range. The market was in a downward moving trend from 2003 - 2005. The market formed a double bottom in mid-2006 and mid-2007 and has rallied since the summer largely as a result of the problems in the credit market.
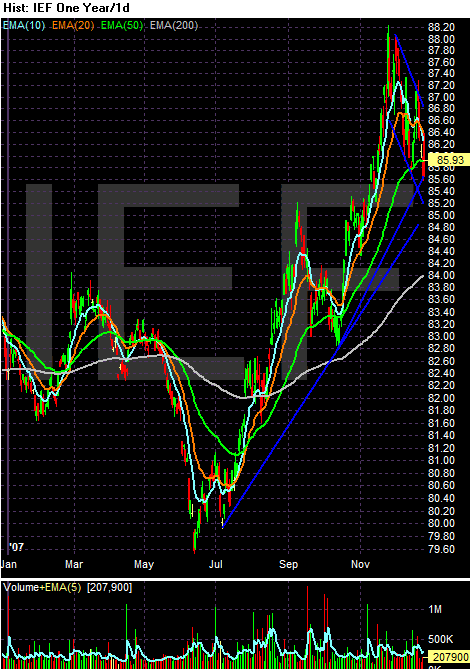
The 6 month chart clearly illustrates the rally. We have two primary moves up followed by very disciplined, profit-taking sell-offs.
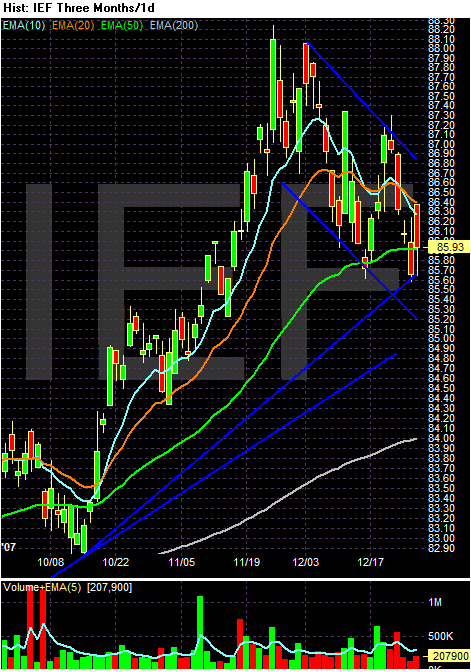
The three month-chart shows the latest sell-off. Notice the market is using the 50 day exponential moving average (EMA) as support and the shorter-term trends (10 and 20 EMS) are both heading lower. But the market is still about the 200 day EMA, implying we're still in a bull market.
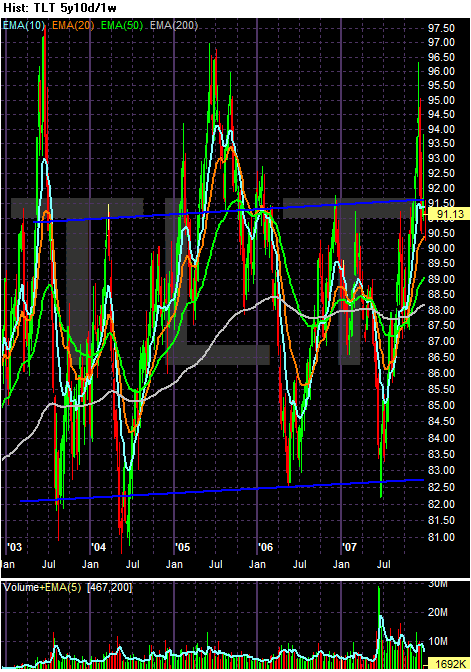
The five year 20+ Treasury market is clearly in one giant trading range between roughly 82.50 and 91.50. While the market has broken out of this range at both ends from time to time it has returned to this range at regular intervals.
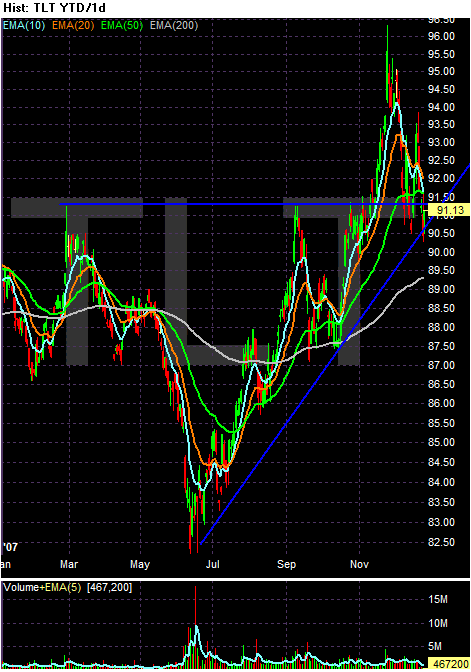
The 6 month chart shows the clear rally the market has been in since the credit crunch started. Like the IEFs, there are two primary moves upward followed by disciplined sell-offs.
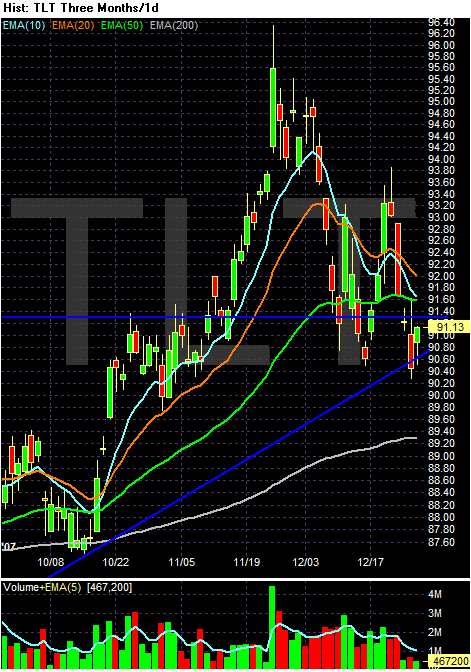
The 3 month chart shows the TLTs are right at their 6-month trend right now. While the shorter (10 and 20) EMAs are moving lower, the primary trend line appears to be the dominate technical force right now.
So -- what comes next? Who knows at this point.