Chipmakers measure inventory in number of days' worth of inventory on their shelves.
"Time after time this quarter, I've watched companies raise their inventory days," Van Hoy said. "It doesn't take long before you start to say, 'This is not going to be a happy quarter.' "
The Semiconductor Industry Association has forecast 7.7% growth in global chip sales this year, after sales rose just 3.2% in 2007 to $256 billion. But Van Hoy says that prediction is looking shaky.
Gartner analyzed fourth-quarter earnings reports and found world chip inventory had spiked to an unhealthy level. Van Hoy says that when this quarter's results are tallied, it will be a very bad one for the chip sector.
The number of chips in the supply chain fell slightly last quarter, Van Hoy says. But with forecasts of falling sales this quarter, higher chip inventory in the supply chain is all but certain, he says.
Another trend is a factor in rising inventory. For the past five years, Van Hoy says, distributors have been cutting their inventory levels. Less inventory on hand means lower costs for them but forces chipmakers to keep more stock on hand, to be sure customers don't run out of supply.
Using its own Dataquest Semiconductor Inventory Index, Gartner last week said its chip inventory index spiked in the fourth quarter to 1.16 from 1.04 the previous quarter. A reading of 1.0 is ideal. A reading above that number means inventory in the supply chain is too high. Rising from 1.04 to 1.16 is a big jump, Van Hoy says. It's enough to raise red flags.
Investors should be wary of chip stocks, he says.
"It's entirely the right thing to urge caution," he said.
It's been forever since I've written about a technology sector. The latest rally (the one that started in roughly 2003) has been about basic materials and energy as opposed to technology. So talking about a tech sector reminds me of the 1990s bull market in a big way.
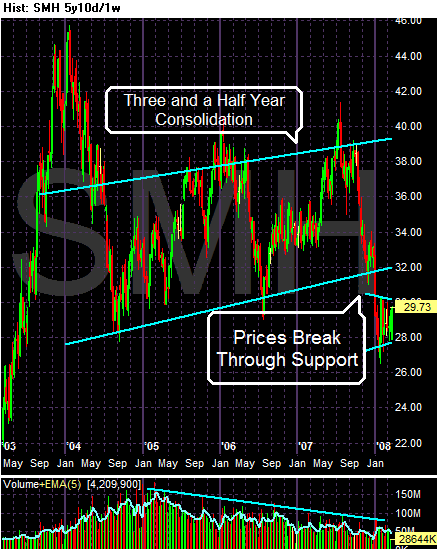
On the long-term chart (5 year) notice that semis have been in a clear trading range for about three and a half years. They've been moving between roughly 30 and 38. In addition, there's been a pretty solid predictability to this averages moves. It has risen for about a year and a half and then retreated.
Also note the volume has been dropping for most of this consolidation pattern.
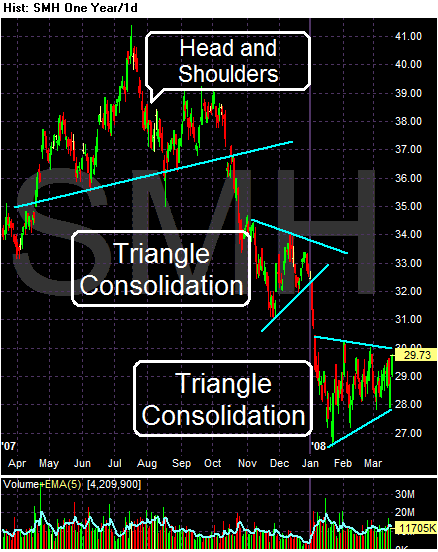
On the year chart notice the following:
-- The average is retreating from a head and shoulders formation that formed in the first half of 2007.
-- There are two triangle consolidations that occurred on the way down.
-- Notice the average is currently right at its long-term support level -- roughly 30/share.
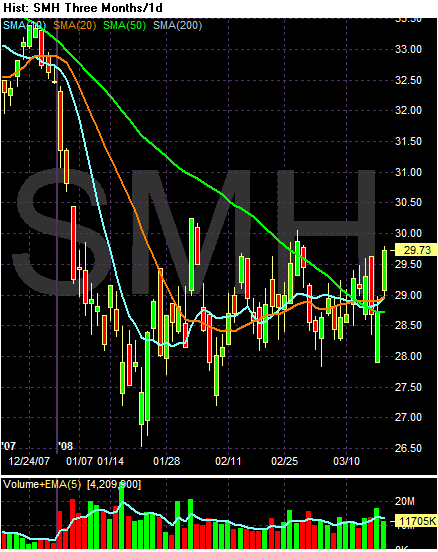
On the simple moving average (SMA) chart, notice the following:
-- Prices are in a very tight range -- roughly 2 points.
-- Prices are clearly consolidating.
-- Prices and moving averages are tightly packed, indicating the market is looking for a place to go.