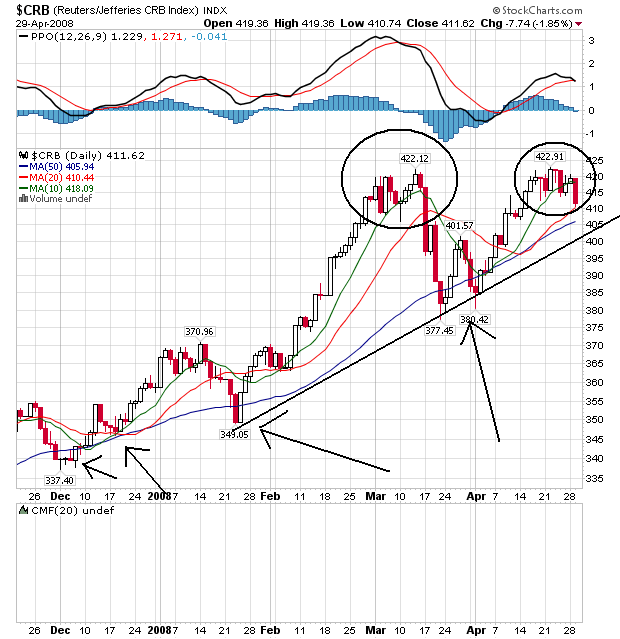
The overall CRB chart is bullish. Notice the following:
-- Prices have bounced off the SMAs for the last 4 months, using them as support
-- The shorter SMAs are higher than the longer SMAs
However, also note the possible top forming; I have circled both tops.
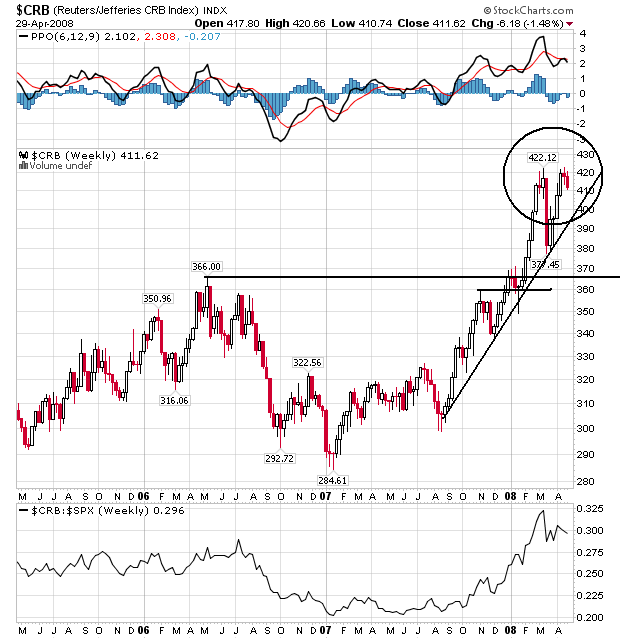
On the weekly chart, notice the following:
-- Prices have been rallying since August
-- Prices have moved through resistance on a regular basis and continually made new highs
-- But, the possible double top is very clear on this chart.
So -- what is going on here? There is growing speculation the Federal Reserve is near the end of its rate cuts -- or will at least pause after today. If this happens, the dollar's slide may stop (at least for now). Because most commodities are priced in dollars a drop in the dollar's value is a de facto increase in a commodity price. So traders are waiting to see what happens with the dollar right now.
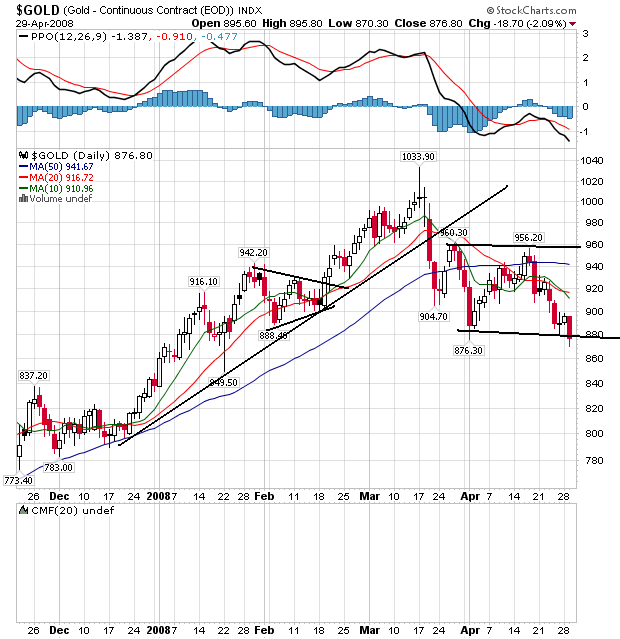
I use gold as a proxy for inflation expectations. Notice the following on the chart above:
-- Prices have dropped below the trend line that started in late December
-- The shorter SMAs have dropped below the longer SMAs -- a bearish signal
-- Prices are below all the shorter SMAs, which will pull these SMAs lower.
-- Prices are now consolidating below the shorter SMAs
This is a chart that says a reversal is occurring in the market.
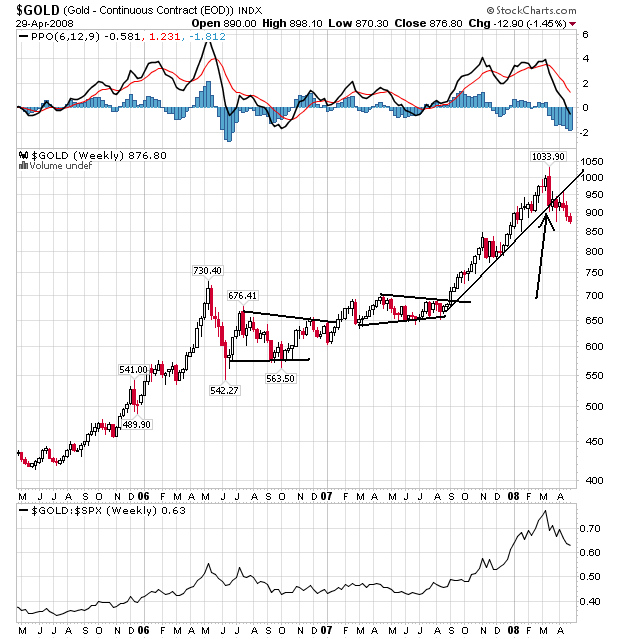
On gold's weekly chart, notice prices have clearly broken the long-term trend line that started at the end of last summer. Again, assuming gold is a valid proxy for inflation (which I think it is), this chart tells us traders are thinking inflation may have peaked, or is about to peak.
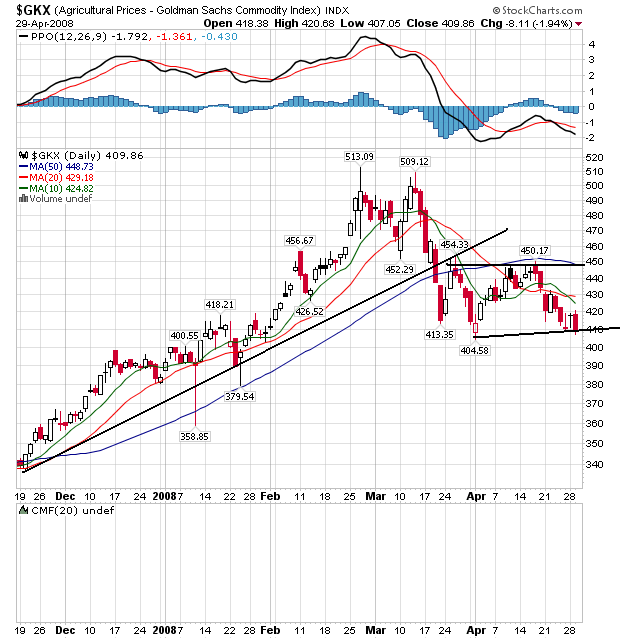
On the agricultural prices daily chart, notice the following:
-- Prices have broken below the trend line started last November
-- Prices are below the SMAs
-- The shorter SMAs have crossed below the longer SMAs
This is a chart that says a reversal may be occurring.
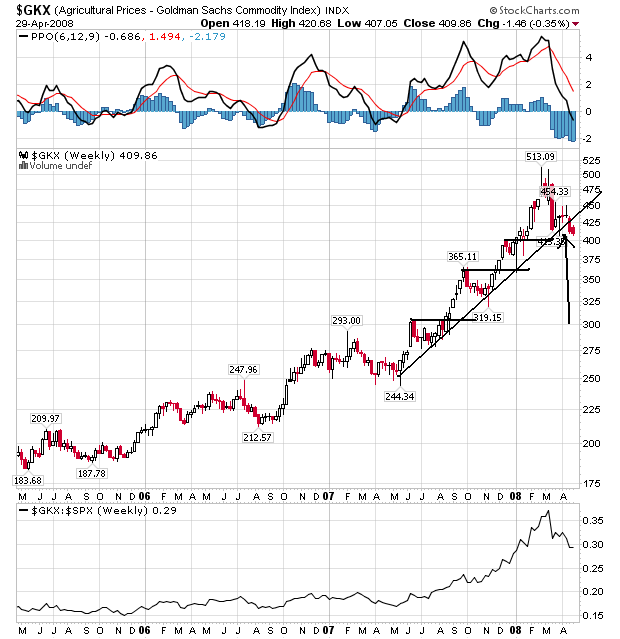
On the agricultural prices weekly chart, notice the following:'
-- Prices have been in a strong rally for about a year, continually breaking through previous resistance to make new highs. BUT,
-- Prices have dropped below the trend line, indicating prices may be in a reversal right now.
So, what's causing this? Several commodities have grabbed the headlines lately. Rice is at the top of that list. Food riots have been reported in some countries and some governments have halted exports. As a result, we get charts like this:
Rice is moving higher in a big way, with little stopping it from the upside right now. So long as we continue to have the same type of news stories expect this chart to continue along its upward trajectory.
Corn is still rallying. It started a new upward move at the beginning of October and is still moving higher. It has broken through hey resistance levels as well.
BUT,
Wheat has broken its uptrend and is clearly looking for a new low right now. This is what is keeping the agricultural prices a bit lower right now.