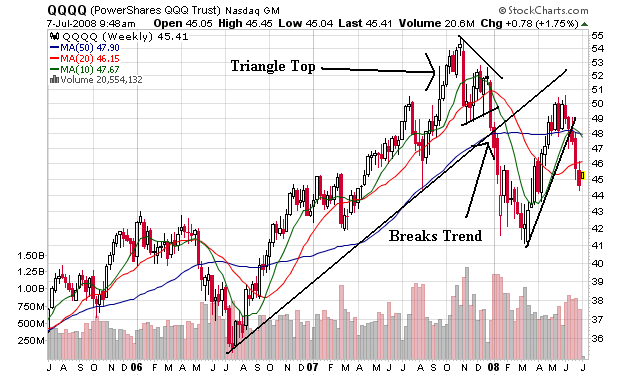
The QQQQs were in a rally from the middle of 2006 to the end of 2007. However, the index formed a double top in 2007 and then went through the trend line at the beginning of 2008. Since then the index has until mid-March when it rose with the broader market. The March 2008 rally was in reaction to the Federal Reserve's involvement with the JP Morgan/Bear Stearns deal. After rallying for a few months, the index is dropping again.
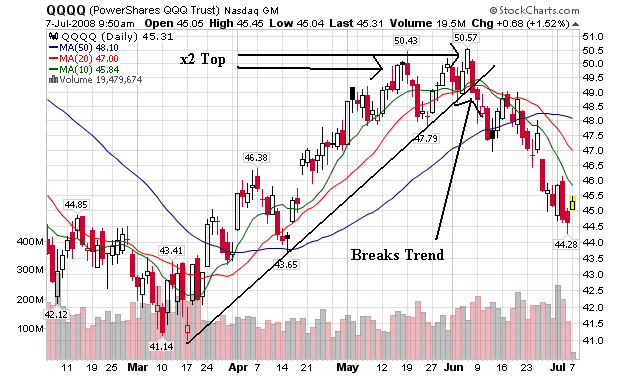
On the daily chart, notice the following:
-- Prices have fallen through the trend line started after the Fed/Bear Stearns deal
-- Prices are currently below all the SMAs
-- The shorter SMAs are below the longer SMAs
-- All the SMAs are headed lower
This chart is turning bearish.
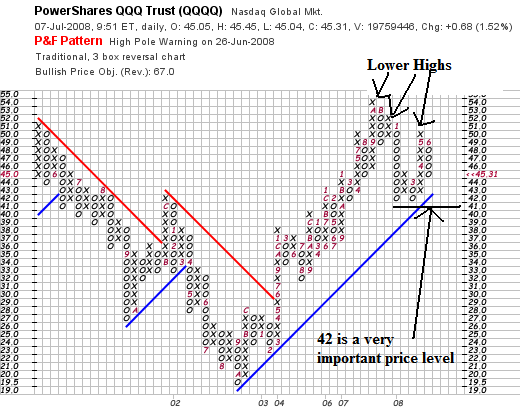
The P&F chart is showing a picture of a chart turning more and more bearish with a set of lower highs. However, prices are still above the important technical level of 42. A move below that level will indicate some serious problems are ahead.