Fannie Mae (FNM.N: Quote, Profile, Research, Stock Buzz) and Freddie Mac (FRE.N: Quote, Profile, Research, Stock Buzz) dropped sharply as some investors worried that the two pillars of the U.S. housing market will need to raise billions of dollars in additional capital through stock sales, diluting the holdings of current investors.
Who are you going to believe -- the idiots who brought you this mess or the analyst who says things aren't that hot. In addition, every time we've heard "things are nowhere near that bad" from a company executive, things have fallen through the floor.
"There is also concern that as the earnings reports come out, that the projections for future performance for technology may not be as strong due to the weakness in economy."
Gee -- do you think that with the economy on the edge of a recession or in one earnings will drop? At least analysts have stopped their happy talk:
Analysts are now expecting a 13.5 percent drop in second-quarter earnings of S&P 500 companies, according to the average estimate of analysts polled by Thomson Reuters. That's compared to the 2 percent drop they were expecting in April.
And it's official --
U.S. stocks crumpled Wednesday, with the S&P 500 closing in bear market territory, as financial and technology stocks took it on the chin in the face of escalating fears about the impact of the slowing economy and credit crunch on coming earnings reports.
.....
The Dow and Nasdaq are off more than 21% from October peaks, with banks crumbling, crude back on the rise and a warning about Cisco.
Let's go to the charts:

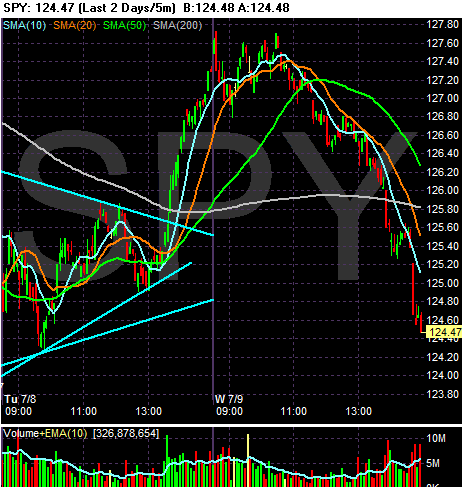
The markets moved sideways with a slightly upward bias at the beginning of the day. Then the market moved through all the SMAs and had small drop right around noon CST. Then after 1 all hell broke lose, with the average gapping down, consolidating and then gapping down again at the end of the trading day.

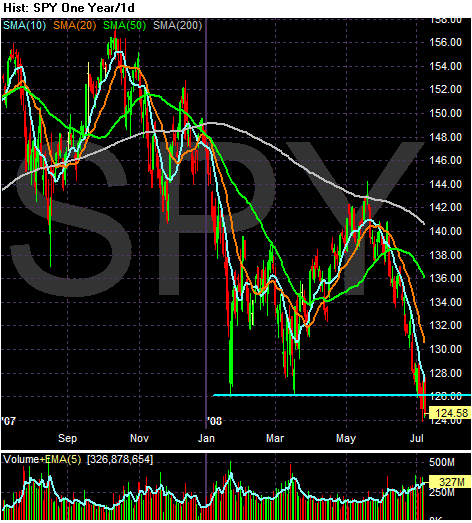
Above is the yearly chart. Notice the following:
-- We're at the yearly lows right now.
-- Prices have moved below crucial support established on two different trading days earlier this year.
-- All the SMAs are moving lower
-- The shorter SMAs are below the longer SMAs
-- Prices are below all the SMAs
Short version: this is a bearish chart, plain and simple.