The BLS reported initial jobless claims of 502,000, and the 4 week moving average declined to 519,750, the lowest in a year.
The ICSC reported that same store retail sales declined -0.1% WoW, the first decline in 7 weeks, but YoY sales improved to +2.9%. They also said that "same-store sales for November could be as strong as +5.0- +8.0 percent [YoY] for the month."
Shoppertrak finally also joined in reporting positive numbers. For the week ending 11/7/09, they reported a Year Over Year % Change of 0.1%, and a Week Over Week % Change of 4.8%.
Oil declined slightly under $80 to about $78, so there is still a little rationality in that market.
The Daily Treasury Statement through November 10, showed payment of $47.4 million in withheld state and local taxes for the month so far, compared with last year's $51.6 million on the same date, indicating state and local government's in severe distress even compared with last year (this is a lagging indicator which tends to bottom about one quarter after the end of a recession on an absolute basis).
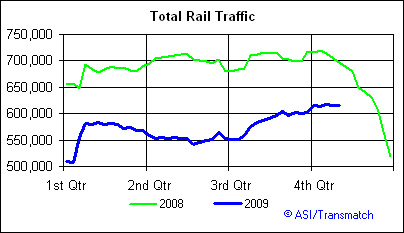
The most interesting weekly statistic, however, was rail traffic, which held steady. Why is that interesting? Because by now rail traffic should be well into its seasonal decline (last year the decline was a "cliff dive"), but traffic has generally held steady at September-early October's levels or even improved, as shown on this graph:

This is a very bullish sign for the economy.