(1) Real retail sales bottom and turn.
(2) Initial Jobless claims turn.
(3) The ISM manufacturing index turns above 50, i.e., signals actual growth.
(4) Industrial Production turns.
(5) ISM manufacturing index is above 53, ISM employment is at -5 or above, initial jobless claims are at least a sustained 16%-20% off peak, and both Industrial Production and Real retail sales have advanced at a rate of 2.5% or more year-over-year from the bottom.
In September, (1) through (4) had apparently already happened. Number (5) is all about the strength of the turns. Based on the strength of the Leading Economic Indicators, I concluded with a prediction that payrolls would most likely hit bottom and turn around in November or December, +/- 1 month.
Two months later, how is that playing out? A major revision in data calls into question one large element of the analysis. There are three very positive developments, and three negative or flat. Details below.
The Positive DevelopmentsI. Initial Jobless Claims
In the first installment of the series, I looked at initial jobless claims. I noted that (1) in those recessions and recoveries where jobless claims fell steeply, peak unemployment occurred within 2 months of the point where jobless claims fell 12% from the peak; but (2) in those recessions and recoveries where jobless claims fell slowly, peak unemployment occurred not at the 12% mark, but only when new jobless claims were more than 16% less than peak claims, and stayed more than 16% off for at least 3 months thereafter.
In September, initial claims were still less than 16% off their highs. That has changed dramatically. Jobless claims have fallen substantially, and as of today the 4 week moving average stands at 514,000, more than 21% off the peak of 658,750, over 7 months ago. Here is a graph comparing this recession with the two previous "jobless recoveries" and the V shaped deep recession of 1982 in terms of the first 7 months of post-peak initial jobless claims:
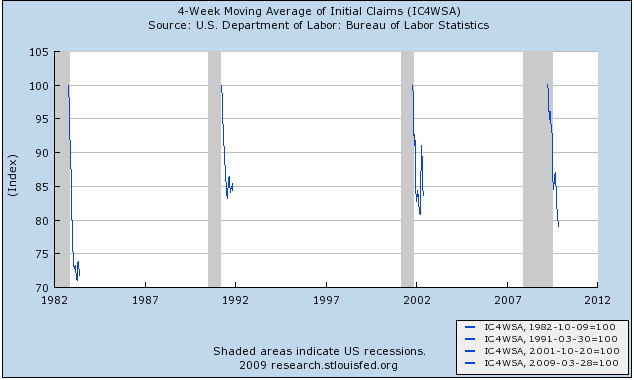
In the last month, our recession/recovery has become more comparable to the 1982-3 recovery than previously. As you can see, in the two "jobless recoveries," new jobless claims failed to penetrate the 20% off level except for a brief instance in summer 2002 (coinciding with a brief positive jobs number). Should the present trend continue this indicator predicts actual job growth this month or next.
[Note: In this regard I am at odds with such esteemed luminaries as Berkeley Prof. Brad DeLong and Calculated Risk, who believe that jobless claims must fall all the way to 400,000 before jobs will actually be added, based on the last two "jobless recoveries." I disagree, based on the recoveries from the deep 1970s and 1980s recessions. All I can say is that the data is already not behaving in accord with their analysis. Nevertheless, I would be glad to be proven wrong provided it occurs quickly!].
II. ISM Manufacturing
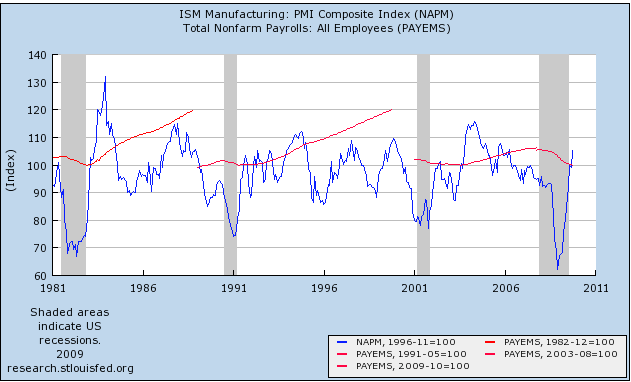
I next looked at the ISM Manufacturing Index, and concluded that the 53 level (50 is the dividing line between expansion and contraction) is the point where jobs began to be added in the very strong recovery after 1982, as well as during the week recoveries of 1992 and 2002. Further, a reading over 54 on the index has always coincided with actual job growth.
Additionally, whenever the hiring vs. firing sub-index was -5 or higher (i.e., no more than 5% more employers plan to fire than hire) and rising, where other evidence indicates a recession is ending, that has always indicated net employment growth was imminent, at least on a temproary basis; and also, whenever current staffing intentions were 65+. and hiring plans were 15+, that has always coincided with positive jobs numbers in the BLS survey, including during and after the "jobless recoveries" of 1992 and 2002.
This record has now been broken. The ISM surged in October to 55.7, and the employment index is at +53.1:
Despite this indication of actual net hiring in the manufacturing sector, the October BLS jobs data claimed 61,000 job losses in manufacturing -- the most in four months! -- and 190,000 total job losses. Everybody knows that the BLS significantly revises their initial numbers, and I suspect the report of job losses in manufacturing is going to be substantially revised.
III. Industrial Production
In part 3 of the series I noted that industrial production tends to peak a median +2 months before payrolls, and to trough at the end of recessions a median +1 month before payrolls. Of the 10 troughs since World War 2, in 8 of them industrial production troughed within 2 months of the payrolls number. Further, the only times that industrial production has led employment growth by a relatively long period of time, it has also shown weak growth -- less than 5% a year. In more typical V shaped job recoveries, it has grown at a rate of 10% or more a year.
In October, industrial production continued to move positively. It has grown 2.9% in the last 4 months, or in other words indeed growing at a rate of more than 10% a year. Here is a graph comparing that growth with growth in the first 4 months of the V shaped recovery of 1983 vs. the "jobless recoveries" of 1992 and 2002-03:
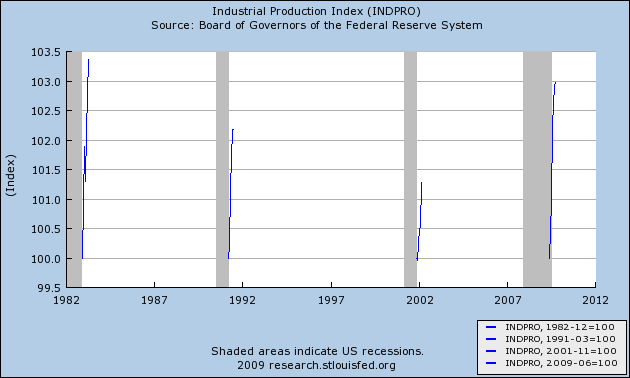
This, like the trend of initial jobless claims, is at levels consistent with actual job growth this month or next.
Three Negative or Flat Developments
I. ISM Non-Manufacturing
One unique factor of this "Great Recession" is how strongly services jobs have been hit, much moreso relative to manufacturing than in any post-WW2 downturn, as shown on this graph:
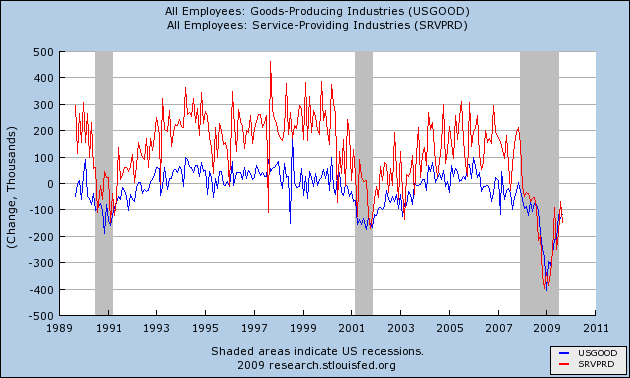
In the last few months, however, the percentage of job losses in services compared with manufacturing has, if anything, increased. Indeed, while the ISM manufacturing report has been strong, the ISM non-manufacturing report has been consistent with the tepid growth in real retail sales. I did not include this in my original analysis, in part because the data does not have a long record at all -- less than 15 years. That being said, here is a graph showing that in the 2002-03 expansion, normed at 100 for an ISM Nonmanufacturing reading of 60, showing that job growth in services did not occur until that point in 2003:
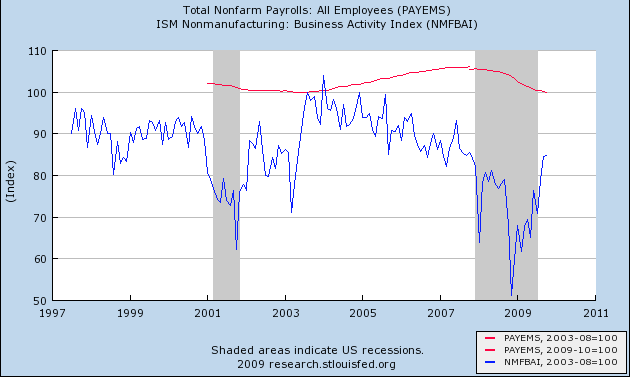
As of October, this index has stalled at just above 50, and the employment subindex fell to 41.1 (meaning substantial layoffs). Based on this sparse record, one would have to say that the prospects of job growth in any services sector in the next few months look remote, at best.
II. GDP Growth
I have previously shown in a discussion of "Okun's law" that over the last decade or more it has taken 2% YoY growth in GDP for even 1 net job to be added. Here's an updated graph demonstrating that relationship (with YoY GDP growth shown in blue, payrolls in red):
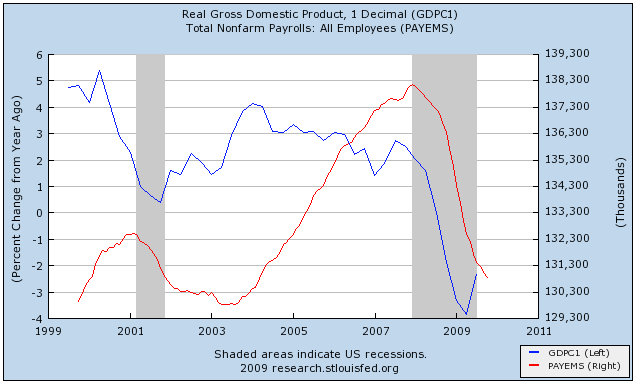
This suggests that, while 3rd quarter GDP was initially reported up at an annual rate of 3.5%, which surprised most people (it may be revised downward somewhat due to increased imports), at least two more quarters of such growth must take place for YoY GDP to reach +2%. The Leading Economic Indicators at this point do indicate positive GDP growth in the 4th quarter, carrying over at least into part of the first quarter of 2010, but after that, the jury is out -- especially with $80 Oil.
III. Real Retail Sales
A major revision of recent data by the Census Bureau calls this element of my analysis into question. I described real retail sales as the Holy Grail of Leading Indicators for job growth, noting that his consistently turned at both tops and bottoms, an average of 3-5 months before job growth or losses turned. When real retail sales stay flat, they generate a lot of noise, and a longer period between the turn in sales and payrolls. Strong turns in sales generate reliable subsequent moves in payrolls in subsequent months. In general, with regard to recoveries, an increase of about +2.5% a year is necessary to reliably generate a subsequent move in real retail sales.
On a three month smoothed average basis, real retail sales bottomed in April of this year. Despite October's growth of 1.4%, nasty revisions downward of August and Septmber totaling -1.3% mean that real retail sales are up only about 0.9% off that low, for an annual rate of 1.7%. In short, the revisions keep real retail sales within the range of "noise." The past few months may be the beginning of a solid upward trend, or continued revisions may mean the series stays flat with no growth whatsoever.
Here is a graph comparing the trend in Real Retail Sales since its smoothed bottom in April with the first 7 months of growth during the expansions of 1983, and 1992, and the first eight months of growth in 2001 (September and October 2001 show extreme volativity for obvious reasons so I also included November):
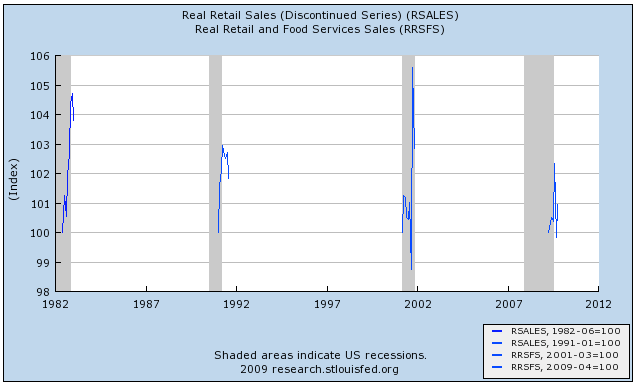
This is simply not consistent with job growth yet.
Conclusion: BLS revisions and John Maynard Keynes
John Maynard Keynes famously justified a change in opinion by saying, "When the facts change, I change my opinion. What do you do?" Well, a critical fact in my analysis has changed.
Three indicators -- ISM manufacturing, Initial Jobless Claims, and Industrial Production -- are now at levels typically associated with actual job growth in previous recoveries. All three of these series exceed their growth in the two "jobless recoveries" of 1992-3 and 2002-3.
The "Holy Grail," however, Real retail sales, is only trending sideways or slightly higher albeit for unique reasons (cash for clunkers). The substantial downward revisions in real retail sales in August and September call into question when the overall jobs number will turn. While industrial production is indeed having a "V" shaped recovery so far, growing at a rate similar to 1983; by contrast, Real retail sales' anemic growth is similar to -- and even weaker than -- its pattern in the last "jobless recovery," below the 3% annual growth typically associated with job growth. The services sector is stagnated with continuing substantial job losses, and GDP growth, while impressive, isn't impressive enough to think that jobs will actually turn positive by year's end.
At the end of the day, the Leading Economic Indicators either work or they don't. If they work, then the coincident indictors of real income, real retail sales, and employment must start to trend upward shortly. What may be developing is a bifurcated economic expansion, in which jobs in manufacturing are added back quickly (hence, not a "jobless recovery") but services continue to shed jobs as consumers continue to repair their balance sheets and shop discerningly for bargains (thus a "job loss recovery"). This tends to move the turning point for jobs into January-March (January at least being consistent with my original prediction).
Finally, as I said in my concluding installment in September and have reiterated since: let me be the first to acknowledge that this is not a scientific truth or certainty, but a best estimate based on a logical review of existing data with a long history that accommodates both traditional and "jobless" recoveries.