This week, naturally, is dominated by the issue of jobs, jobs, jobs. Somebody on CNBC actually made some sense a short time ago by noting that Congress and the Obama Adminsitration probably wish it had paid more attention to this issue, and less on healthcare this year. Surely there was a sense of "Mission Accomplished" conveyed by the Administration once they passed the stimulus legislation in February, dusted off their hands and moved on to the next item on their "to-do" list.
Anyway, I have been harping for a few months now on how Real Retail Sales is the "Holy Grail" forecasting future jobs growth, and produced a variety of graphs showing how one led the other, typically by about 5 months. Today I want to look at a few variations on that theme.
First of all, the same leading nature of Real Retail Sales is apparent on graphs showing year-over-year change, for example this graph showing the last ten years:

A similar relationship as that found as to the absolute numbers exists: about half the time there is a two month difference of less between the number of months between a trough in Retail vs. jobs, and the number of months when each series crosses from negative to positive. In other words, if YoY% of Retail decline troughs 6 months before YoY% of jobs decline, there is a 50/50 chance that Retail will become positive 4-8 months before jobs on a Y-o-Y basis.
Secondly, while before 1982 there was no relationship between the YoY% of retail decline/growth vs. absolute monthly number of jobs lost/gained, in the recessions/recovery since then, there has been a relationship, and never moreso than in the last year:
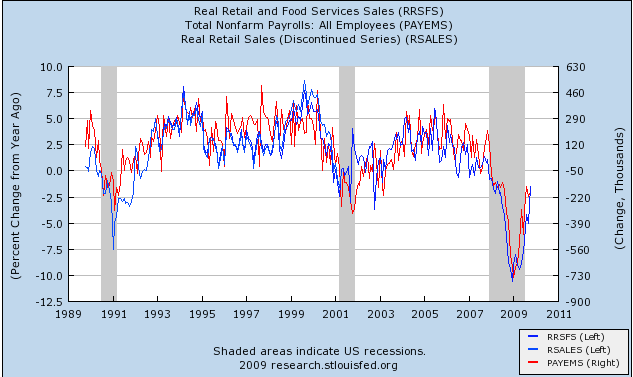
I have noted previously how in this "Great Recession" services jobs have been particularly hard hit. While the above graph just shows correlation, not causation, it is fair to say that in the last year, employers have behaved exactly as if they are making decisions based on YoY retail spending, with the breakeven point of 0 jobs at +0.7% YoY retail growth.
This point is amplified by the below graph of the ISM non-manufacturing employment index (which is only about 15 years old)(the line), and BLS monthly jobs data (the bars). Especially when we average the ISM data over three months (not shown on the graph), the correlation seems exceptionally close, with the crossover point actually being about 48 or 49 rather than 50.

The above two graphs of ISM non-manufacturing employment, and YoY% change in real retail sales, are the two that have continued most closedly to correlate (on a coincident, not leading basis) with jobs data in the last year.
So where am I leading? First, the employment number in tomorrow's ISM non-manufacturing index is very important. While it only precedes the BLS payrolls number by one day, it is important confirming information from a private source.
Secondly, with November's good auto sales data, and so-so same store sales data, it looks likely that November Real Retail Sales will hold steady or show slight improvement. Unless we think that December's sales are going to tank, then YoY Real Retail Sales in December are going to be slightly positive, on the order of +0.5% to +1.5%. If the relationship between YoY retail sales and monthly jobs data continues to hold (obviously not a guarantee), then:
(1) there is a good chance that YoY payrolls, which troughed 8 months after Real Retail sales, will cross zero at some point between June and October of next year, meaning that the trough in "actual" jobs (as opposed to YoY%) will be some number of months before then; and
(2) any number above +0.7% (which could happen as soon as December's data), per the second graph above, would more likely than not correlate with job growth rather than losses (+/- monthly noise in the payrolls data).