This week we got good reports and Housing Permits and Starts. Both are up on a YoY basis for the first time since the housing bust began, starts just barely, permits substantially. Permits also rebounded from their recent surprise decline, Starts were down from last month and basically meandering sideways for the last 6 months.
Edmunds "cautioned that the seasonally adjusted annual rate for U.S. auto sales could be 10.5 million in January." That would be the lowest rate in 3 months. Auto sales are seasonal, so just as good sales in December weren't good enough for a positive real retail sales report, this month might not be "bad" enough for a poor real retail sales report.
Leading Economic Indicators for December were up 1.1%. On a YoY basis, they are now up over 7%. This is the best YoY performance in nearly 25 years except for a brief period in 2003, and portends strong growth for this quarter and at least the beginning of next quarter.
Turning to the high frequency weekly indicators, the ICSC reported same store sales for the week of January 16 up 2.0% from the week before and up 2.6% from the year before. This isn't as good as it sounds, since inflation is running close to 3% at the moment.
Similarly, Shoppertrak reported sales down (-7.6%) from the prior week, and up a slight +0.8% on a YoY basis.
Railfax showed cyclical and intermodal traffic up vs. a year ago (which was the exact bottom). Comparisons start getting hard this week. If numbers don't improve, both may be negative YoY again, but seasonality makes that unlikely.
The BLS reported initial jobless claims of 482,000 last week, and the 4 week average went up to 448,250. There was an indication that this reflected an administrative backlog, i.e., the last two week's numbers should have been worse, and this week's better. Recall that a week ago I said that the seasonal adjustment was probably too optimistic, and to expect the weekly claims number to rise to about 480,000, which would in no way disturb the year-long declining trend. Next week the seasonal changes pretty much wash out. So long as the jobless number next week begins with a 4 and not a 5, the trend is still in place.
Oil has declined to $75 a barrel, which is good, and gasoline at $2.74 also declined slightly from last week, but is still above its range for the last few months. Usage is in seasonal decline, but more ominously is on the verge of going negative YoY.
Now our special bonus, h/t Angry Bear, the following graph of Daily Treasury Withholding Receipts (red lines), and YoY 5 day smoothed average (black dotted line):
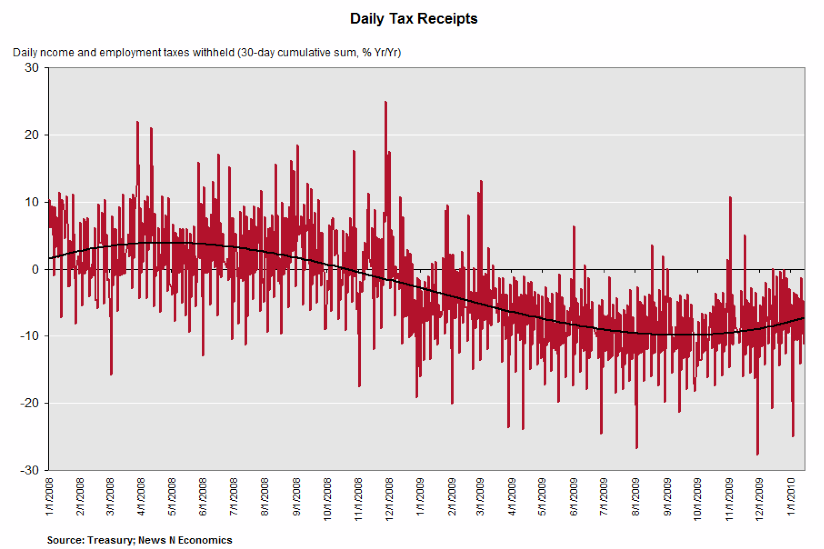
The YoY went negative in October 2008 (almost a year after the recession started) and appears to have bottomed in October 2009. If it takes until October 2010 to turn positive, that suggests the actual seasonally adjusted bottom might not be until this spring, which obviously puts the states and federal budgets under severe distress.
But the YoY average might turn up more quickly. As of January 20, the Daily Treasury Statement showed $96.6B in withholding taxes pain this months, compared with $101.0B on the same date last year, a decline of (-4.4%).
In the next 60 days or so, given the tougher YoY comparisons, we should have a good idea how sustainable the recovery is going to be. This week, the comparisons in retail sales, gasoline, and rail traffic looked worrisome.