When the personal income and spending reports came out yesterday, I remarked to Bonddad that it was about as good as could be hoped for in one month's data in the current environment: spending was up enough to keep the expansion going, income was up even more, and savings were also up - a long term benefit.
Back in summer of 2007, before the "Great Recession" officially began, I used to describe what was about to happen as a "s l o w m o t i o n bust," meaning it was going to be a 19th century style deflationary bout, but would occur as the 20th century bulwarks gave way one by one, kicking and screaming, although there would undoubtedly be some very bad days (September-October 2008, anyone?). I believe Paul Krugman refered to it as "not your father's recession." Indeed, it could be called your great grandfather's recession.
But those 19th century panics did repair themselves, although some of them, like the Panic of 1873, took the better part of a decade to really abate. Once they hit bottom, as consumers repaired their balance sheets suddenly and in unison, spending and expansion slowly resumed.
Yesterday's data calls that to mind, so let me show you how the consumer, in the aggregate, is faring.
Consumers are paying down or refinancing debt at lower rates and/or amounts, and have reversed the entire last decade of debt service expansion:
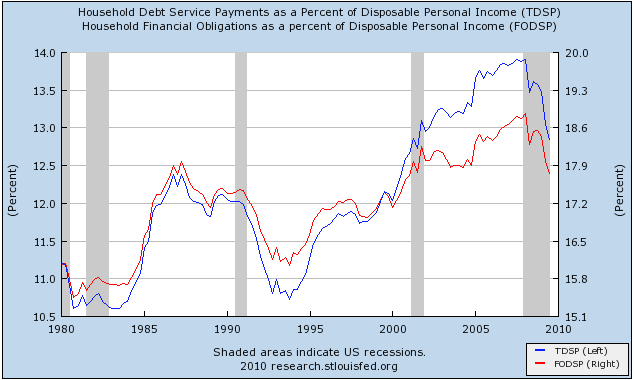
Consumers are a little over halfway to the more normal level of debt service from the 1980s and earlier 1990s.
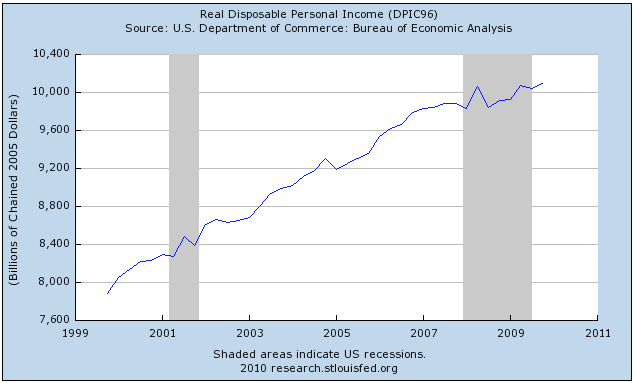
Their real disposable income has been increasing slowly over the past year:
With increased disposable income, and decreasing debt service obligations, Americans are saving more. As of December, the personal savings rate was 4.8%:
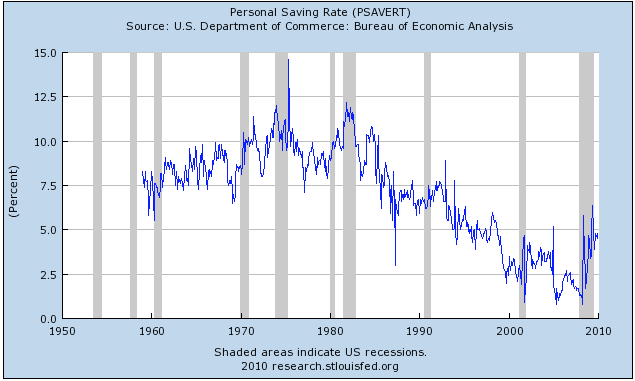
meaning that, on a per capita basis, consumers are a little less than half the way back to their longer term savings rate before the middle class gutting commenced.
In the aggregate, personal savings rose from $126.3 Billion in the 1st quarter of 2008 to $595.7 Billion in the 2nd quarter of 2009 (blue line), and are at $516.9 Billion now, which can be compared in "real" terms by factoring in the inflation rate (the red line):
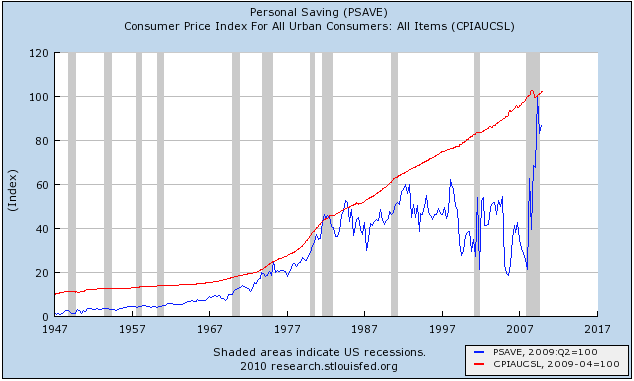
-- meaning that at its peak in spring of last year, as much personal savings was available to be spent in the economy in real terms than at any point since early 1984.
Courtesy of the St. Louis Fred's new toy, we are able to divide aggregate personal savings by the inflation rate, and graph "real personal savings":
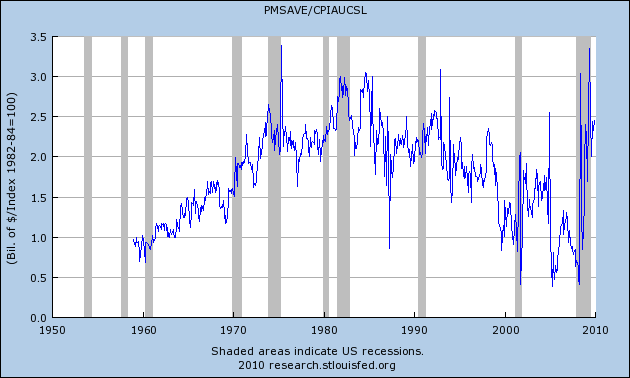
-- confirming that there is more "fuel" for continued economic expansion than at any time in nearly 30 years.
Of course, the "average" includes a huge skew savings and wealth towards the uppermost portion of wealth, so much so that Andrew Kaplan suggeted half a year ago that “The Savings Rate Has Recovered…if You Ignore the Bottom 99%”, by which he meant that the entire amount of savings above could potentially exist entirely in the top 1% of society. That's not the case, but as Lakshman Achuthan of ECRI pointed out a few months ago:
If you are earning over $100,000, then your plans are to spend over 50% more than last year. That’s stunning. Equally stunning was that if you are making less than $30,000, then you are going to cut your spending by a third.In other words: personal savings have improved to the point where it can power at least a modest expansion -- but it is still a "Gilded Recovery."
In a related backdrop, the wealthiest consumers, say those in the top decile of earnings and net worth – and this is not something new – account for almost half of all spending. The lower 90% account for the other half.