While the SPYs are in a clear consolidation phase over the last two days

The QQQQs were still rallying according to the primary trendline (a) until about mid0day yesterday (b).
 And the Russell 2000 is still in an uptrend (b), although yesterday's price action is bearish (b).
Also note the risk factor part of the previous three charts: the riskier part of the market (IWM) are still rallying and the QQQQs were rallying until mid-day yesterday. This tells the risk trade is more alive than previously thought.

The SPYs are right at the 200 day EMA.

The QQQQ are through the 200 day EMA

The IWMs are through the 200 day EMA, although they are under the 10 day EMA.
The point of the above information is the equity averages are improving technically pretty quickly.

The long-end of the yield curve rallied into the long-term trend line yesterday. The next week or so of price action will be very important. Will the trend lower continue or not?

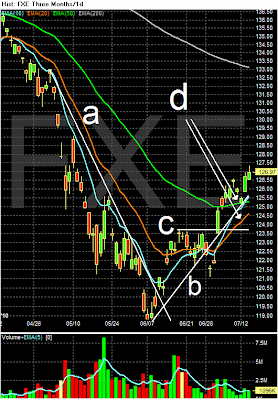
A big reason for the increase in risk tolerance is the euro's recent rise. Notice that prices have broken the downtrend (a) and are clearly in an uptrend (b). Prices have broken through important technical resistance levels (c) and the EMA picture is turning positive -- the 10, 20 and 50 day EMAs are rising, the 10 day EMA has moved through the 50 day EMA and prices are above all three.