[Note: this is the second part of my 2011 outlook]
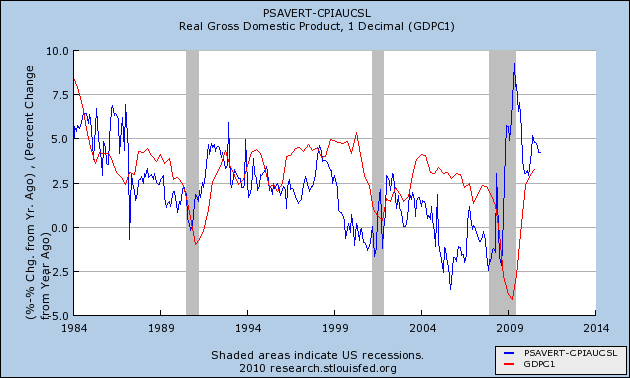
In the final months of 2010, there has been a palpable sense in the data - in the continuous decline of initial jobless claims, in the increase in consumer spending at Christmas, in the increase in car purchases, in the renewed vigor of manufacturing - of an economy that is trying to accelerate to lift-off. Indeed, I have noted several times recently that measuring the savings rate in real, inflation adjusted terms (blue in the graph below), seems to be an excellent precursor to economic growth several years after (red), and in that regard, there is an awful lot of tinder available to start the fire of a self-sustaining recovery:
Yet it is a telling statement about economic and political blogs, and the media in general, that when I attempted a Google Trend search for the term "self sustaining recovery," there weren't even enough references to generate a graph! - even though the term "double dip recession" still generates a steady stream of hits.
While I have been among the most optimistic of observers for over a year and a half, and while the K.I.S.S. forecast (relying on the LEI and the yield curve) suggests continued growth in 2011, if the economy fails to achieve lift-off this year -- if it fails to generate a self-sustaining recovery, then I fear the consequences going into 2012. For there are two forces in a race to determine which will by then be the dominant determinant of the direction of the economy as it affects average Americans - namely, deleveraging and deflation.
Per Housing Wire, the New York Fed just updated its report on household behavior during the Great Recession, finding that
Note that the data has only been reported through the 3rd Quarter of 2010. If the trend holds up, by the end of 2011, households will have debt service as low a percentage of disposable income as any time in the last 30 years. While there is nothing magical about that particular level, it certainly would bode well for the consumer continuing to power a self-sustaining recovery, in line with the first graph of the relationship between the "real personal savings rate" and GDP above. [N.B.: This is also not inconsistent with data showing that much of the decline in consumer indebtedness being caused by writeoffs and tighter lending standards.]
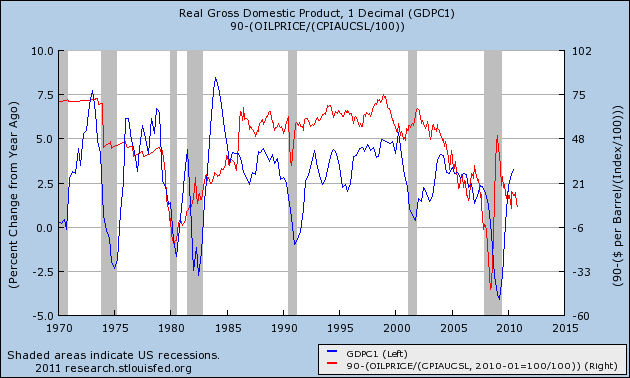
Against that, as has been widely noted in the last few weeks, there is the "choke collar" of energy prices. For the second time in less than a year, as the economy starts to accelerate, so do Oil prices, biting into consumer demand and creating a drag. Whenever Oil prices have hit 4% of GDP, which in 2010 was about $90 a barrel (inflation adjusted, in blue and inverted in the graph below), there has been a slowdown in the economy (red), and a recession if the overshoot is too sudden or too much:
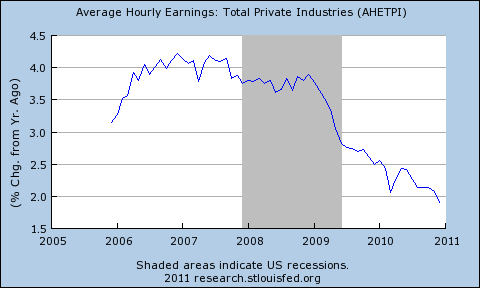
While that threatens several quarters of growth deceleration, the true and growing danger is that of outright wage and salary deflation. Specifically, as Professor Paul Krugman has pointed out any number of times, YoY wage growth continue to edge closer and closer to zero, and outright deflation:
During the Great Depression, of course, wage deflation was part of a vicious spiral, as lower wages meant ever less ability to service previously contracted debt. It has been a saving grace of this economy that, unlike then, wages have not tipped over into outright deflation. Thus with near zero percent interest rates, and one percent inflation, consumers have been able to refinance debt at lower percentage rates, lowering their monthly debt payments, and even 2% wage growth has been sufficient to increase the "real" disposable income of consumers, in however small a fashion.
With unemployment still close to 10%, and not projected to drop quickly, there is an awful lot of slack in the system, applying tremendous deflationary pressure on wages and salaries. Should wage and salary deflation hit, even 1% inflation would, in real terms, mean a decline in consumers' actual purchasing power. As shown in the graph below, that is exactly what happened during last summer's slowdown:
When real income increases again outpaced inflation, consumer spending went up again.
It is hard to imagine a self-sustaining recovery - or any at all - should wage deflation actually start. At its present rate, this trend looks like it will also reach the tipping point in about a year or two.
If we are lucky, consumer deleveraging will reach bottom first, and the fire in the engines of the economy will be lit sufficiently for it to achieve lift-off before we reach the point where wage and salary growth goes all the way to zero and beyond.
Keep your fingers crossed.
In the final months of 2010, there has been a palpable sense in the data - in the continuous decline of initial jobless claims, in the increase in consumer spending at Christmas, in the increase in car purchases, in the renewed vigor of manufacturing - of an economy that is trying to accelerate to lift-off. Indeed, I have noted several times recently that measuring the savings rate in real, inflation adjusted terms (blue in the graph below), seems to be an excellent precursor to economic growth several years after (red), and in that regard, there is an awful lot of tinder available to start the fire of a self-sustaining recovery:
Yet it is a telling statement about economic and political blogs, and the media in general, that when I attempted a Google Trend search for the term "self sustaining recovery," there weren't even enough references to generate a graph! - even though the term "double dip recession" still generates a steady stream of hits.
While I have been among the most optimistic of observers for over a year and a half, and while the K.I.S.S. forecast (relying on the LEI and the yield curve) suggests continued growth in 2011, if the economy fails to achieve lift-off this year -- if it fails to generate a self-sustaining recovery, then I fear the consequences going into 2012. For there are two forces in a race to determine which will by then be the dominant determinant of the direction of the economy as it affects average Americans - namely, deleveraging and deflation.
Per Housing Wire, the New York Fed just updated its report on household behavior during the Great Recession, finding that
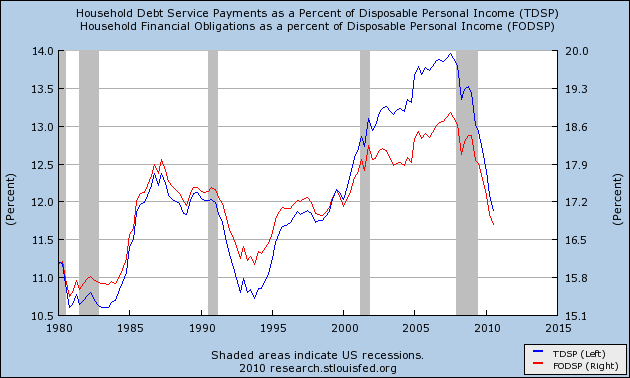
Consumers were pessimistic about the availability and tightening of credit during the [Great Recession, and ...]The result has been the greatest deleveraging by households in the history of the series of household debt service tracked by the Federal Reserve:
Consumers responded to the economic stresses of the recession by curbing spending, reducing contributions to retirement accounts and paying off debt.
The savings rate during the recession largely reflects a decline in debt as households paid down mortgages and is not reflective of increased contributions to retirement or savings accounts.
Note that the data has only been reported through the 3rd Quarter of 2010. If the trend holds up, by the end of 2011, households will have debt service as low a percentage of disposable income as any time in the last 30 years. While there is nothing magical about that particular level, it certainly would bode well for the consumer continuing to power a self-sustaining recovery, in line with the first graph of the relationship between the "real personal savings rate" and GDP above. [N.B.: This is also not inconsistent with data showing that much of the decline in consumer indebtedness being caused by writeoffs and tighter lending standards.]
Against that, as has been widely noted in the last few weeks, there is the "choke collar" of energy prices. For the second time in less than a year, as the economy starts to accelerate, so do Oil prices, biting into consumer demand and creating a drag. Whenever Oil prices have hit 4% of GDP, which in 2010 was about $90 a barrel (inflation adjusted, in blue and inverted in the graph below), there has been a slowdown in the economy (red), and a recession if the overshoot is too sudden or too much:
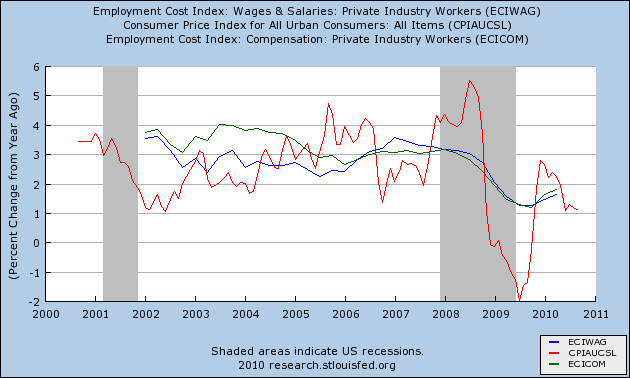
While that threatens several quarters of growth deceleration, the true and growing danger is that of outright wage and salary deflation. Specifically, as Professor Paul Krugman has pointed out any number of times, YoY wage growth continue to edge closer and closer to zero, and outright deflation:
During the Great Depression, of course, wage deflation was part of a vicious spiral, as lower wages meant ever less ability to service previously contracted debt. It has been a saving grace of this economy that, unlike then, wages have not tipped over into outright deflation. Thus with near zero percent interest rates, and one percent inflation, consumers have been able to refinance debt at lower percentage rates, lowering their monthly debt payments, and even 2% wage growth has been sufficient to increase the "real" disposable income of consumers, in however small a fashion.
With unemployment still close to 10%, and not projected to drop quickly, there is an awful lot of slack in the system, applying tremendous deflationary pressure on wages and salaries. Should wage and salary deflation hit, even 1% inflation would, in real terms, mean a decline in consumers' actual purchasing power. As shown in the graph below, that is exactly what happened during last summer's slowdown:
When real income increases again outpaced inflation, consumer spending went up again.
It is hard to imagine a self-sustaining recovery - or any at all - should wage deflation actually start. At its present rate, this trend looks like it will also reach the tipping point in about a year or two.
If we are lucky, consumer deleveraging will reach bottom first, and the fire in the engines of the economy will be lit sufficiently for it to achieve lift-off before we reach the point where wage and salary growth goes all the way to zero and beyond.
Keep your fingers crossed.