


Above are the charts for the treasury market, starting with the shortest maturity and going to the longest. The shorter maturities are at support again, while the TLTs are approaching support. The IEFs have a bit to go. The point is money needs to leave the treasury market to provide fuel for the stock market to get the equity markets to stop correcting. However, the charts above say that won't be happening yet.

The IWMs represent the riskiest areas of the equity market, so their position gives us an idea for where we might be in the correction cycle. Prices have rebounded that last two days and are currently approaching both the 50% Fib level and resistance established during February.

On the daily chart, prices have rebounded into the 10 and 20 day EMA -- both of which are heading lower. Additionally, the 10 is now below the 20. While the MACD is moving lower, the volume indicators are not showing a mass exodus from the market.

Note the QQQ's have risen to near previous highs.
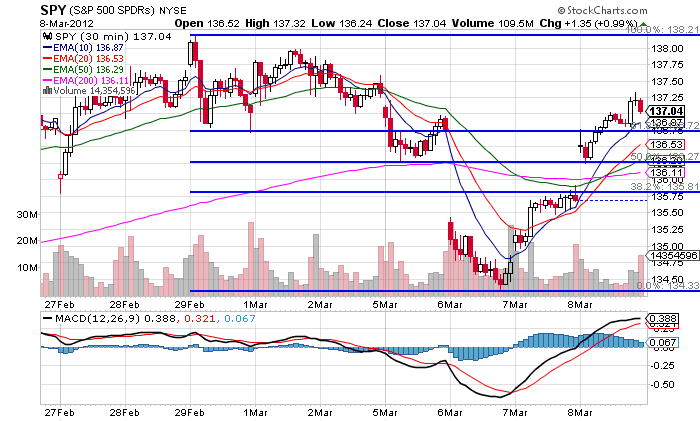
The SPYs, meanwhile, have rebounded above 30 minute Fib levels.

The junk bond market has broken support and is headed for either the 50 day EMA or the support established in late October of last year.
Nothing in the above charts shows any kind of serious, long-term damage to the markets. Instead, everything looks like the standard sell-off in the middle of a rally.